Just scan the QR code on the back of your bag. Each BLISS CO product comes with a custom lab-backed report powered by PhytoFacts™ – giving you a full breakdown of cannabinoids, terpenes, aroma, and expected effects. It’s everything you need to understand what you’re consuming – and why it makes you feel the way it does.
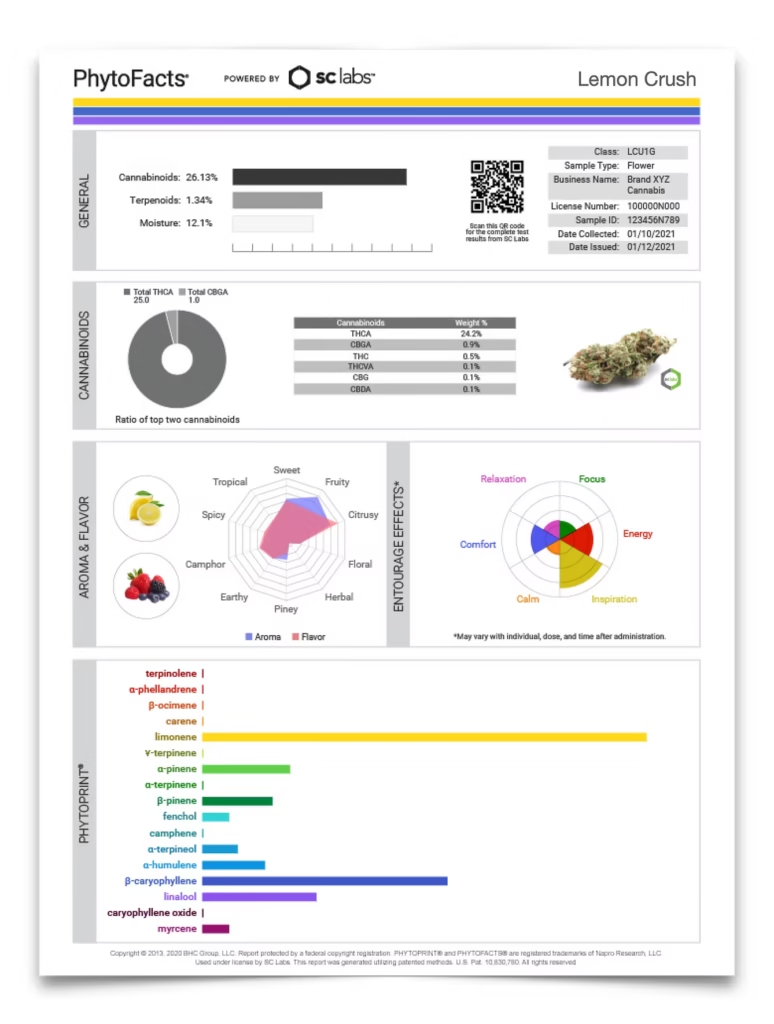
Color bars depict the top three terpenes, in order of weight percent. This can be used to easily identify and group similar cultivars.
This chart displays overall flower content, featuring a ratio indicator fixed at 30% cannabinoids, 3% terpenes, and 20% moisture.
Accurately sort unknown samples into major chemometric families, each with several subcategories that highlight similar organoleptic and physiological properties.
This dial displays the ratio of the top two cannabinoids. The dominant cannabinoid drives pharmacology, while the runner-up modulates it.
The top 6 cannabinoids found in the sample are represented in the table.
An algorithm converts terpenoid and cannabinoid data into suggested effects, based synergistic action within the endocannabinoid system.
The PhytoPrint characterizes the terpene profile of the flower. Bar color and length allow for easy identification of possible patterns between cultivars.